Math Isn't a List. It's a Graph.
A mission statement. Why we’re building PrepBox to measure mathematical substrate — and why test scores can’t see it.
This is a mission statement, not a product brochure.
We are trying to build a math system that measures real mathematical reasoning and builds real substrate under it — the kind of substrate that lets a kid recognize a problem in different clothing, recover from a mistake on their own, and finish a hard problem when no procedure tells them what to do.
We aren't fully there yet. What follows describes the architecture we are optimizing toward and where we are in the work. Because the destination is clear, we know what to build next.
When your kid does math, they're building one of two things.
A list, or a graph.
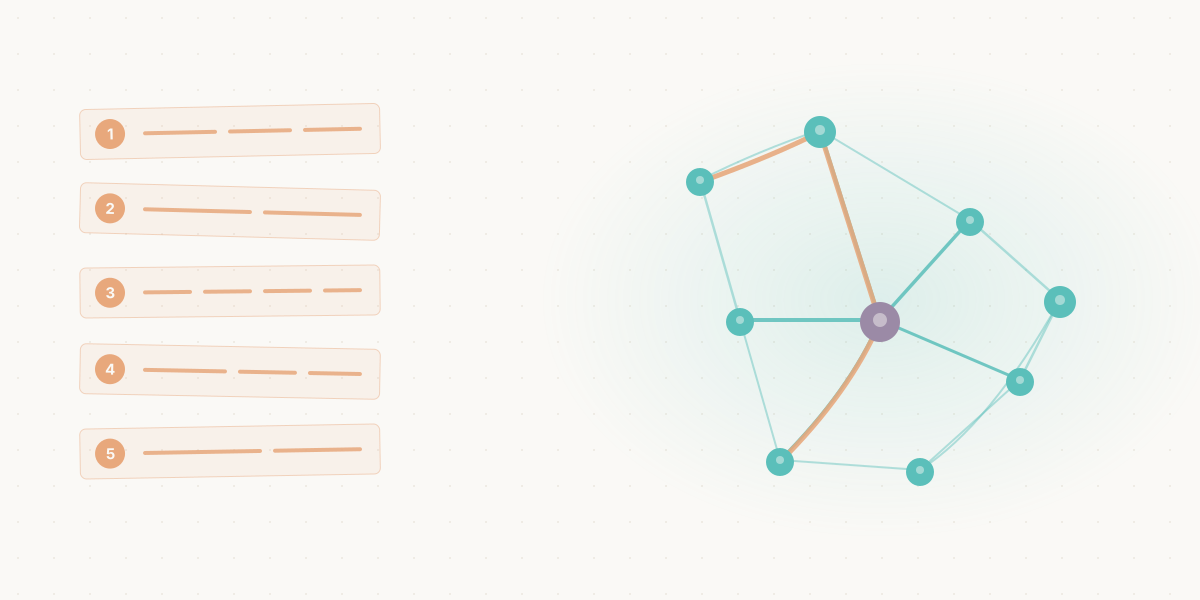
The list is a stack of procedures. How to divide fractions. How to find the slope. How to factor a trinomial. Each one stored separately. The list grows. Nothing connects.
The graph is different. It's a web of math ideas, weighted by use, traversable in any direction. New problems land somewhere on it and reorganize what's nearby. Old ideas get pulled forward when they fit. The graph is the conceptual understanding beneath procedural fluency — what we mean when we say a kid "really understands" math.
The graph has a name. It's called substrate.
Substrate is what lets a kid recognize a problem in different clothing, generate their own approach, know what they don't know, catch their own mistake, and think alongside a teacher instead of in front of one.
Substrate is what we measure.
Why tests and drills can't see this
A test measures one thing: did your kid get the right answer.
A drill measures two: speed and accuracy.
Neither can see substrate — but not for the reason most people assume. Tests do show work. Scratch marks, crossed-out lines, the order of operations a kid attempted, the place where a mistake first crept in — it's all there on the page. The problem isn't that the process is invisible. The problem is what happens to it.
What a teacher actually needs to see substrate is the real-time version: the pause before the kid wrote 24, the ninety seconds spent staring at the wall before they began, the moment they noticed something didn't fit and started over, the help they asked of the sibling next to them. This kind of expert noticing is the most valuable part of teaching. A test gives you the residue. A teacher standing next to one kid for thirty minutes sees the live signal. A teacher with twenty-five kids in a classroom sees almost none of it.
And even the residue — the parts that are on the page — rarely become anything. A test gets marked. The mark gets returned. The process clues — the consistent sign errors, the skipped setup steps, the way a kid keeps reaching for the wrong starting strategy — almost never get coded into a record that follows the kid across topics and weeks. They live in one teacher's memory for as long as the teacher remembers. The output of a test is a number, not a per-student action.
This is why a kid can ace IXL and freeze on the first unfamiliar word problem. The list got longer. The graph was never touched. It's also why a kid can struggle in the same way for two years before anyone names the pattern. The clues were there. Nothing was watching for them.
To see substrate you need three things: the live signal of how a kid is thinking, captured at the moment it happens; a per-student record that tracks the pattern across problems, topics, and time; and a system that turns the pattern into the next action, not the next number.
That doesn't exist on paper. It has to be captured at the moment of thinking — and it has to be remembered after.
The format problem
The deeper problem is this: the goal isn't to know how a kid did on a test. The goal is to know what to teach them next — at this moment, in this topic, with this gap, this strength, this hesitation. That goal cannot be served by paper. Not because paper is old, but because paper as a format was never designed to feed a teaching decision. It was designed to certify an outcome.
Multiple choice was the industry's attempt to fix this. Scan a bubble sheet, get instant data, build a "personalized" learning path. But multiple choice doesn't just preserve less than open paper — it preserves less than almost any format ever invented for math. The kid's attempt is gone. The wrong approach they considered and dropped is gone. The half-right setup that almost worked is gone. All that's left is A, B, C, or D. From four letters, no system can tell whether a kid guessed, eliminated, reasoned, or knew. A wrong answer on a multiple choice question collapses a thousand different mistakes into the same data point.
A worksheet site that gives your kid 200 multiple choice questions a week has 200 data points and almost no signal. We collect fewer questions and far more about each one.
What paper gets right (and how we kept it)
There's one thing paper does that we have to take seriously. Writing by hand changes how a kid thinks.
Kids who form letters by hand recognize them faster than kids who learn by typing. Students who take notes by hand outperform laptop note-takers on conceptual questions. Brain scans show more activity in memory regions during handwriting than during typing — not as a side effect, but as part of how the memory gets laid down.
The reasons aren't mysterious. Writing is slower, so a kid has to choose what to put down. The motor act of forming a number is itself a piece of learning. The page becomes a spatial map — a kid remembers where the answer went, not just what it was. And the small corrections a hand makes — the cross-out, the rewrite, the half-erased line — are learning events in their own right.
This is the part of paper we couldn't lose. The rest — the residue-only format, the inability to track a kid across time, the test that produces a number instead of a next action — had to go.
So we kept the pencil. We replaced the page.
The PrepBox whiteboard preserves every cognitive benefit of handwriting and captures everything paper throws away. Every stroke is timestamped. Every erasure preserved. The kid is still writing by hand, on a surface, with a stylus that behaves like a pencil. The system is doing the part the page never could.
The math graph
Capturing the right data isn't enough. The data has to land on something that can read it.
That something is a graph.
Your kid is building a graph in their head. Our system needs a graph in front of it. The two have to talk.
Math is usually taught as a list — chapter 1, chapter 2, chapter 3. But the underlying structure is a network. Adding fractions depends on understanding fractions, which depends on equivalence, which depends on parts of a whole. Solving a linear equation depends on inverse operations, which depend on the meaning of equality. Every concept has parents, children, and cousins. Every concept can be reached from many directions.
The PrepBox math graph is built by hand. Five thousand topics across grades one through twelve. Around a thousand prerequisite edges so far — built by curriculum experts, one at a time, the work ongoing — each weighted by how strongly the earlier topic supports the later one, and validated against real student work, so we know when an edge is theoretically real but practically irrelevant.
The graph has a second layer that most personalized learning systems don't have at all: cognition difficulty.
Here's what we found in our own student data. A grade six problem that asks a kid to come up with their own approach is cognitively harder than a grade eight problem that asks the same kid to apply a procedure they were taught last week. Grade level and challenge level are not the same axis. Programs that personalize by grade — "your kid is in seventh grade, here's a seventh grade problem" — are personalizing on the wrong dimension.
The graph measures both. The content layer knows what your kid has the prerequisites for. The cognition layer knows what's actually going to stretch them. Together they let us find the place a kid will grow — the next problem that's just above their current floor, on the topic where the graph says they're ready to climb.
That place has a name. Educators call it the Zone of Proximal Development. Not too easy, not too hard. The place where growth happens.
Most programs claim it. Almost none of them can find it.
What the system sees and what it does
When the data from the whiteboard meets the math graph, five specific things become visible. Each one is a signal of substrate forming — or failing to form — and each one shows up in the session report your kid's tutor sends you, with the resolution improving as we sharpen each measurement.
Recognition. Did your kid see what kind of problem this was? We track this across hundreds of questions and surface the topics where recognition holds and the topics where it doesn't.
Generation. When the problem didn't tell them what to do, did they try anything? We watch the moments where a kid has to invent a path, not walk one — try-and-fail is a substrate signal; freeze-and-wait is a different one.
Calibration. Did your kid ask for help at the right moment, or bluff through, or freeze too early? Each pattern leaves a different fingerprint and points to a different next step.
Recovery. When they got it wrong, did they catch it themselves? Self-correction is the clearest evidence the graph is doing its job, and we see it in the strokes before we see it in the answer.
Composability. Could your kid think alongside the tutor, not just listen? The tutor sees these moments live and flags them — the kid pushed back, extended an example, or asked a question that changed the lesson.
These five become the spine of the report. Not a percentage, not a grade — a picture of the graph forming.
The system uses the same five to pick what comes next. When recognition is solid on a topic but generation isn't, we send a problem that demands invention. When recovery is failing in one area, we surface a problem where the same mistake would be obvious. The graph knows where your kid is on the content axis and where they could go. The whiteboard data tells us where they actually are. Today the graph and the data narrow down the next problem and the tutor confirms; over time the system is increasingly picking on its own.
This is also where the teacher's job changes.
In most programs, a tutor's job is to decide what to teach. In ours, the system handles that. The graph and the data choose the next problem; the tutor walks in with that choice already made. What the tutor brings is the part the system can't: motivation, pressure, encouragement, the read on whether a kid is checked out or just having a hard day. The tutor isn't a content delivery mechanism. They're a coach. And coaches are the part of teaching that doesn't scale and can't be automated — they're the part that decides whether your kid finishes a hard problem or gives up.
What we're trying to build
The destination is this: a math system that produces kids who can use mathematical thinking to close loops in open systems.
A closed loop in an open system is what mathematics actually does. A real problem doesn't come with a question already written and an answer waiting in the back of the book. You have to decide what you're solving. You have to decide what counts as a solution. You have to decide when you've finished. That decision — taken inside the math, not outside it — is the test of substrate.
Most A-grade kids can't do this. Not because they aren't smart, but because no one ever asked them to. The system that taught them rewarded executing closed problems someone else defined. We are trying to build a system that rewards the other thing.
We aren't fully there yet. The graph is incomplete, the cognition layer is still being calibrated, the report is still being shaped, the tutor handoff is still partly manual. But the destination is clear, and a clear destination is what tells you what to build next.
We will know we got there when a kid sitting with us, given a problem with no question on it, picks up the pencil, decides what to ask, decides how to answer, and decides when they're done. That's the moment substrate becomes visible. That's the moment math stops being a subject and starts being a way of thinking.
That's what we're trying to build.
— Min Founder, PrepBox