Teaching is the original taste job
Great teachers notice. They're often bounded by time, unable to address or push on what they've seen. With the right tools, the teacher who notices is finally the teacher who acts.
There is a moment that happens in every good tutoring session, usually about ten minutes in, where the teacher catches something the student hasn't said yet. The student is partway through a problem, the pen has slowed, and a great teacher will lean over and ask a question that turns out to be exactly the right question. The student blinks. They didn't know they were stuck on that. The session shifts.
That moment is most of what good math teaching is. It is also, I have started to realize, the same kind of moment most of the rest of my own work is starting to be about.
I have been building a lot with AI over the last couple of years — software, tools, small systems for the tutoring business. The shape of that work has shifted in a way I did not expect. Actually producing the output has become the easy part. What fills the day now is recognizing whether the output is any good, and figuring out what is actually worth building in the first place. That is 99% of the work. The other 1% — the part I used to think of as the work — the tools handle.
Sitting back in the tutoring office, I started to see that this is also a near-perfect description of what good teaching has always been. The prepping of materials and the marking of homework — what most of a teacher's week gets eaten by — is the 1%. The 99% is noticing the quality of a student's thinking and the shape of their struggle, and knowing how to connect and engage with them when they do. That is the teacher's version of taste plus problem selection. It is what they are doing in the moment when they lean over and ask the right question.
The problem is that the teacher, in any setup I have seen up close, has not been allowed to spend most of their time doing this.
The five jobs a teacher carries at once
A teacher — or a tutor, or a parent helping at the kitchen table — is actually carrying five jobs at once. They are trying to be engaging in the moment. They are trying to build a relationship with the student so the student wants to show up next week. They are preparing the right content for this specific kid, today. They are teaching it. And then, after the session ends, they are marking the work, analyzing what went well, and preparing material to fill whatever gap showed up.
Two of those five — being engaging, building the relationship — are where the taste lives. They cannot be done by any tool, ever, and a teacher who is great at them is doing some of the most valuable work in education. The other three — prep, instruction, marking and analysis — are necessary, but they are not where the leverage is. They are the price the teacher pays so that the noticing layer can happen.
For most teachers I know, the price is what eats the week. They arrive at the next session having spent four hours on the back-three layers and forty minutes on the front-two. The student gets a tutor who is, in the most literal sense, distracted. There is a loop that wants to close between what the student did and what the teacher does next, but the teacher is too tired to close it well.
This is the loop we built PrepBox to close. A great math teacher isn't great because they mark fast — they're great because they notice. The whole design question for our system has been: how do we give the teacher back the hours they currently lose to everything except acting on what they've already noticed?
The data, without instrumenting the child
Doing that needed two things. A way to capture how a student actually thinks while doing math, and a way to make sense of what was captured. The capture had to be honest about what data we wanted, and honest about what we refused to do to get it. There are real products being deployed in classrooms right now — EEG headbands, eye-trackers, camera-based attention monitors — that produce extraordinarily rich data by instrumenting the student directly. They are not something we are willing to put on a child. So the question became: what is the least-invasive instrument that still gives us enough signal to reason about how a student thinks?
The answer turned out to be the tablet. A student solving a math problem with a pen on a tablet does exactly what they would have done on paper — except every stroke is timestamped, every pause is recorded, every erasure is preserved, and the order in which the work was built up is captured. The student feels nothing different. The data layer is dense.
Strokes alone are not enough, though. A million stroke vectors with no organizing framework is just storage. The interpretation layer is the math graph — a network rather than a list of isolated skills — over 3,400 topics, educator-built, with teacher-verified prerequisite connections between them. Strokes get tied to questions; questions to topics; topics to a graph of what depends on what. That is the layer that turns a Grade 10 quadratics mistake into "the missing fragment is Grade 5 fraction division." Without the graph, the strokes mean nothing. Without the strokes, the graph has nothing to be applied to.
Two pictures we built
What this lets us produce, for every student, are two pictures we have not seen any other math program produce.
The first is a picture of skill versus mastery, plotted across the months a student has been with us.
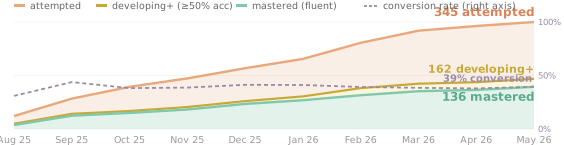
Three lines tell the story. The top orange line is every distinct skill the student has attempted — the breadth of their exposure to new math. The middle yellow line is what we call developing-plus: skills where they've gotten at least half the questions right over three or more attempts, but haven't yet put together a fluent streak. The bottom green line is fluent mastery — three correct in a row, at speed, retained later. The dashed purple line riding high on the chart is the conversion rate: of everything they've touched, how much has actually become fluent.
For this Grade 7 student, ten months of practice covers 345 attempted skills, 162 at developing-or-better, and 136 at fluent mastery — a 39% conversion rate. That percentage is more useful than any of the raw counts. When it rises, the student is consolidating faster than they're being exposed to new material. When it falls, the calendar is pushing them faster than their consolidation can catch up. When the orange line plateaus while the green line keeps climbing, the student is going back and locking in earlier material — which looks slow on a report card and is, in fact, often exactly what they need.
A folder of marked worksheets or a dashboard of right/wrong percentages cannot produce this chart, because mastery in the sense we mean it requires speed and retention data per question, not just a final grade. Every dot on every line traces back to a stroke-by-stroke record of a real attempt on a real day.
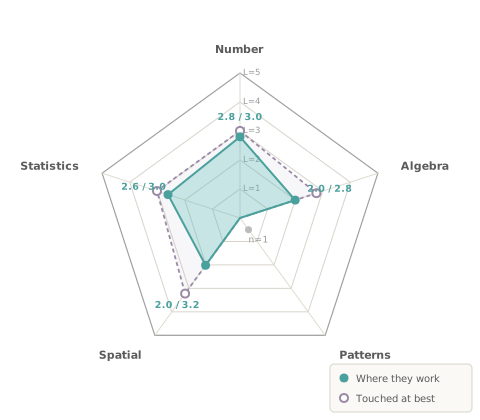
The second is a five-axis radar of cognitive level by math domain — Number, Algebra, Patterns, Spatial, Statistics.
Two shapes share the radar. The filled teal pentagon shows where the student is currently working — the cognitive difficulty band they're reliably consolidating, per strand. The dashed purple outline shows what they've touched at best — the harder material they've reached at least once but haven't yet locked in. The gap between the two shapes, per strand, is the story.
For the same student, Number is the most consolidated strand: working at L = 2.8, touched at 3.0. Almost no gap — she owns that strand. Statistics is similar, working at 2.6, touched at 3.0. Algebra and Spatial tell a different story. She is working at L = 2.0 in both, but has reached higher in past attempts — Algebra to 2.8, Spatial to 3.2. The gap means she has been exposed to harder material in those strands without yet building fluency in it.
This is what the chart tells her teacher, in one image, before the next session begins. Number and Statistics are where the student can carry weight while something harder is being built. Algebra and Spatial are where the next layer of growth lives — and where care is needed, because the gap between "reached" and "consolidated" is wide enough that a clumsy push would just stretch it further. A report card would say "B+ in math." Same kid, same week, four strands at four different operating levels, with two of them carrying a meaningful gap between the floor and the ceiling. That distinction is what a teacher needs to know before they walk in, and what a parent needs to know before they look at a single grade and try to figure out what it means.
These pictures are not the point. They are the evidence that the underlying loop has closed. When a teacher walks into a session with a report like this already read, they are not spending the first twenty minutes figuring out where the student is. They start with the noticing.
That noticing is the part of the job that matters, and it matters more now than it ever has. The machines around us are getting very good at producing surface answers, which means the underlying skill of judging an answer is the one that suddenly has to be cultivated everywhere. This is the difference between executing a procedure and understanding the structure beneath it. A kid who can tell whether a result is right matters more than a kid who can produce one quickly. That is taste. It is the same skill the teacher is using when they lean over and ask the right question — they are showing the student, every session, what taste looks like in the act.
This is the part of the story I find quietly exciting. The most valuable human work of the next decade is what good teachers have always been doing. Building a system that gives them their time back to do it isn't just an operational improvement for one tutoring center. It is a small bet on the kind of work that is going to matter most — and on the kids who are watching a teacher do it, in front of them, with their own homework.
If you want to test whether your child's math program is set up for this, ask one question of whoever is teaching them: where in my kid's math does the noticing actually happen, and how do you protect the time for it? You will learn a great deal from the answer.