Why I’m Building a MathGraph for Every Student I Teach
After 20 years of teaching, I can finally show families the understanding that marks leave out.

I have been teaching math for 20 years. What has kept me in it is the feeling of real understanding—the moment separate ideas click together and a problem finally makes sense.
I know the difference between that feeling and becoming fluent at one type of test question. I have felt it in my own learning and seen it in my students. Fluency matters. It helps a student work accurately and with confidence. But depth takes more time. It grows when a student asks why, meets the same idea in different forms, and connects it to what came before.
Students do not all want the same thing. Some love the feeling of full understanding as much as I do. Others understandably want the shortest path to a good mark. I teach students at many ages. Some are still forming study habits. Others arrive with years of habits already in place. I meet each student where they are.
The challenge is that marks are usually the only visible goalpost. It is hard to ask a student to invest in deeper understanding when the result is real but hard to see. Some of the students I still hear from years later came to value both: the fluency to perform and the understanding to think.
Over the years, I started mapping what I had learned as a teacher. I have now mapped nearly the full school-math journey I teach, breaking it into small topics and rungs. Each rung marks a change in difficulty that I have repeatedly seen in student work. One rung supports the next.
The MathGraph turns that map into something students and parents can see. It does not give a child another number. It shows where their work sits, which connections are forming, and where support may matter next. This starts with the families I already work with, and it will shape how I teach future students too.
Parents know how much that visibility matters. When children are young, you can often see knowledge forming in real time. A child notices a pattern, asks why, tries another example, and connects today's idea to something they discovered yesterday. You may not know the curriculum labels, but you can see the understanding grow.
As the mathematics gets harder, more of that learning moves out of view. It happens at school, in tutoring sessions, or behind a laptop. What reaches home is often a completed page or a mark.
Somewhere along the way, progress becomes invisible. The mark becomes the signal.
Marks matter. They tell us how many answers were correct on one piece of work. What they cannot tell us is how the child was thinking, which ideas are connected, or what should happen next.
This matters even more now. AI can often produce polished steps and answers in seconds. A student still has to know whether those steps make sense, when to use them, and what to do when the familiar method does not fit.
That does not make practice obsolete. Facts and procedures are important tools. But having the tools is not the same as knowing which one to use.
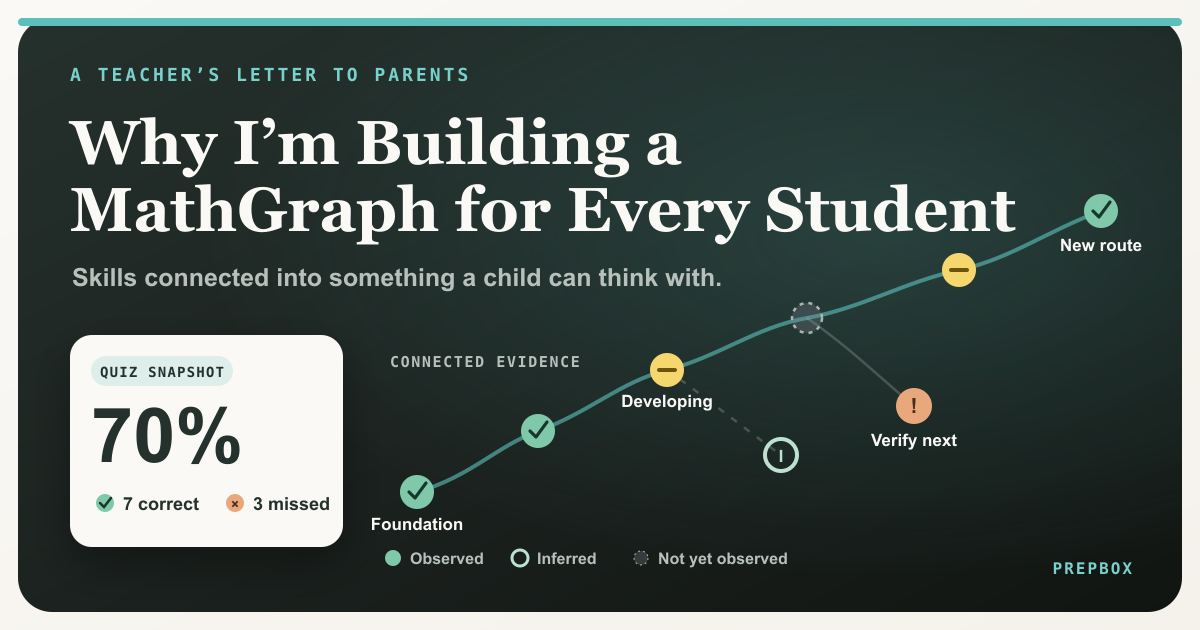
The future of math is not fewer skills. It is skills connected into something a child can think with.
Critical thinking in math means knowing when a method fits and when an answer looks wrong. Creative thinking means finding another path when the familiar one fails.
Both depend on connected knowledge. Fractions support ratios. Ratios support percent. Earlier ideas give a child somewhere to start when a problem looks new.
That is why I think of mathematical knowledge as a graph, not a list.
The nodes name the ideas. The connections explain how one idea supports another—what a child can build on, where a gap may sit, and which next steps make sense. Without carefully mapped connections, the graph would be only a scattered list of skills.
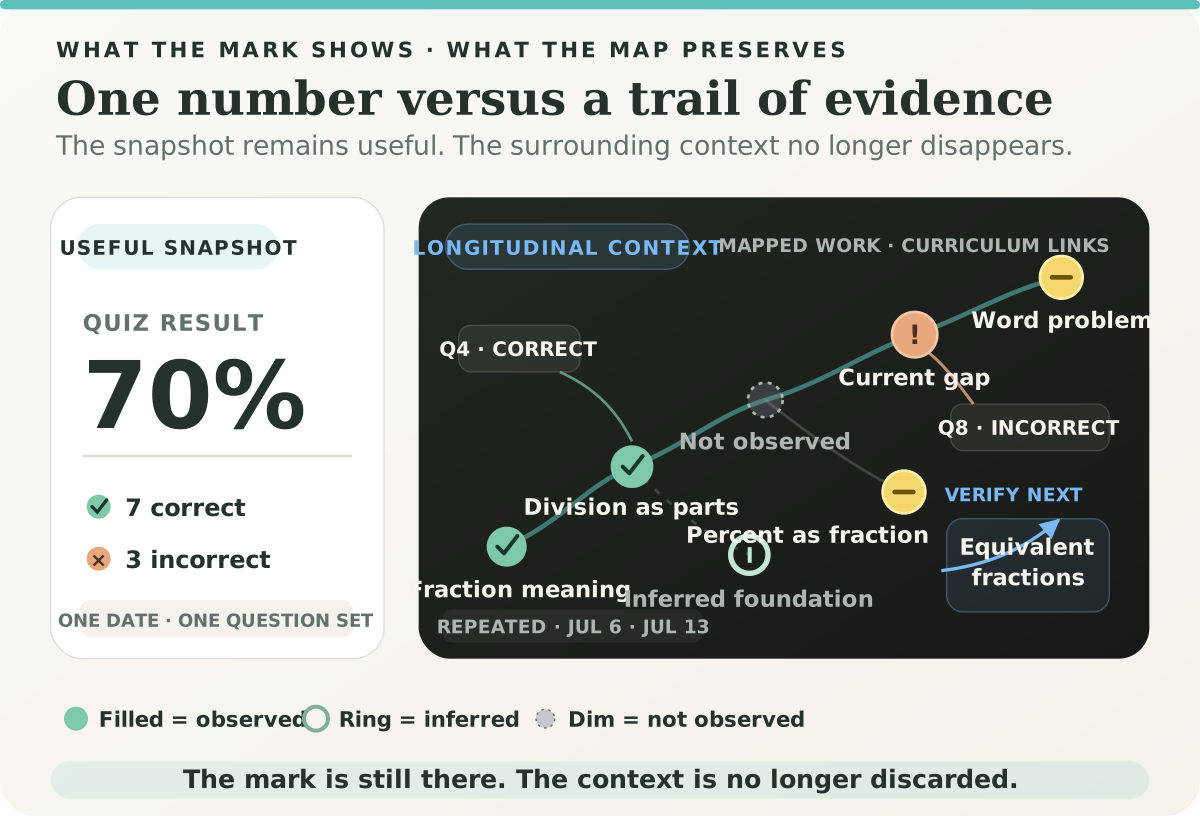
Consider two students who both earn 7 out of 10—a 70% mark.
The first student understands the ideas underneath the lesson. The new question was simply unfamiliar. I may need to show the idea in a different form and let the student try again.
The second student's misses point back to an earlier gap. More practice on today's topic would treat the symptom. I need to strengthen that earlier idea first.
The mark is the same. The next lesson should not be.
Start with one day: the work behind one stronger topic. Then zoom out: thirty days show the pattern growing around it. This is an anonymized illustration, not an identified student record.
The MathGraph preserves the context that a mark leaves out.
Each problem is placed on an educator-built map of math ideas. I can see what the question tested, which earlier ideas support it, and where the student's work fits.
The graph also shows what we know—and what we do not. A filled dot means the student worked on that idea. A pale ring means later work suggests an earlier idea may be in place, but we have not tested it directly. A dim dot means we do not have evidence yet. It does not mean the child is weak.
The MathGraph does not replace the quiz. It gives the quiz context.
A mark tells me how a child performed on one set of questions. The MathGraph brings many such moments together across connected ideas and over time. With enough varied evidence, it can give me a better estimate of what the child understands—and what I should check next. When the evidence is thin, it should say so. Missing evidence stays unknown, and inferred foundations stay provisional until new work tests the picture.
Because the ideas stay in the same places while the evidence changes, I can see whether an idea appeared today, became steadier over a week, or was still there a month later. PrepBox lets me replay the latest session, the week, the month, or the longer history. MathPulse turns that history into a parent-friendly journey from Day one to Today. The animation is not the point. Seeing the pattern is.
A mark shows one moment. The MathGraph shows evidence growing across connected ideas over time.
For the parents of students I teach, this is the change I want you to feel. A report should not stop at a mark. It should show what is strong, what needs support, what changed, and what I plan to do next.
If your child currently studies with me, you can now log into the MathPulse app, open Units, and tap Explore MathGraph. You will see the connected picture that your child's work is beginning to reveal.
Making the graph accurate is one challenge. Making it easy for parents to understand is another. A mark is easy to read because it reduces one result to a single number. The MathGraph is not that simple. It keeps the ideas, connections, and change over time. That makes it more useful, but also harder to understand at a glance. I am improving that view now, and your feedback matters.
I have also written about how to tell whether understanding survives a changed problem. The MathGraph helps me keep that evidence instead of reducing it to one number.
The MathGraph will not replace conversation, written work, or teaching. For me as a tutor, it is an invaluable tool. It helps me carry evidence from one session to the next and deliver more consistent guidance. I hope it becomes a guide for parents too—not so you have to diagnose or teach the mathematics yourself, but so you can see the connected understanding growing, understand why I am choosing the next step, and support your child with confidence.
Open MathPulse, tap Units, and explore your child's MathGraph. Then tell me:
What feels clear—and what still needs a better explanation?